New feature
Enhancements
Fixes
Drivers: Trend analysis now available to all users
With this release, all Daylight users can access Drivers: Trend Analysis, previously a premium feature. Use this new version of the feature to harness Drivers’ powerful blend of qualitative and quantitative data through time-based comparisons.
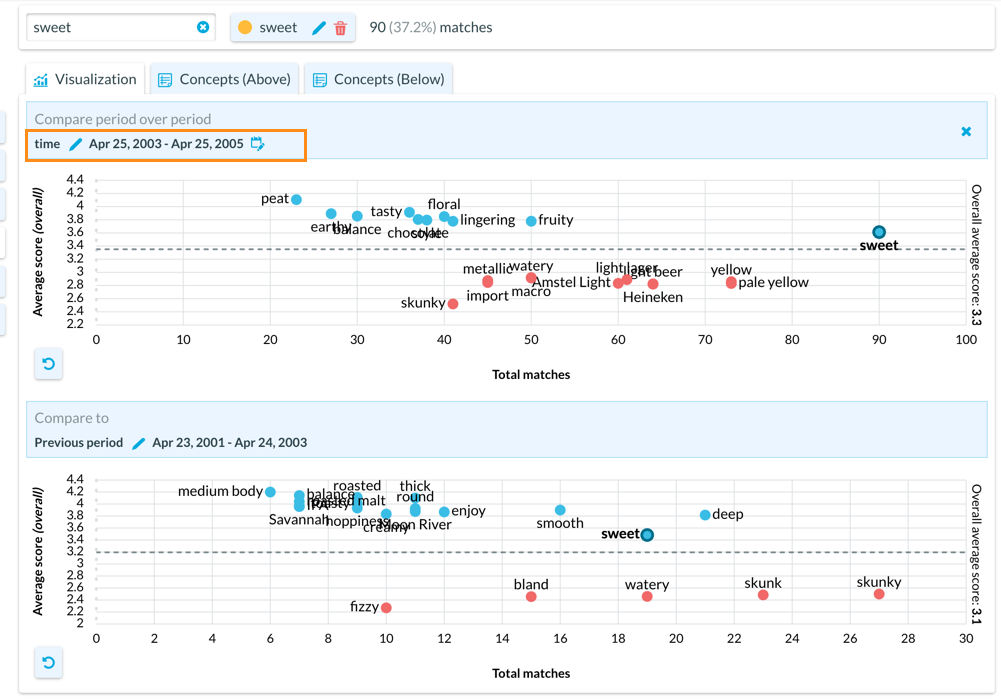
This feature offers comparative scatter plots you can use to discover directional changes in drivers over time in periods you define using the options based on any metadata date fields included in your project.
To use trend analysis in Drivers
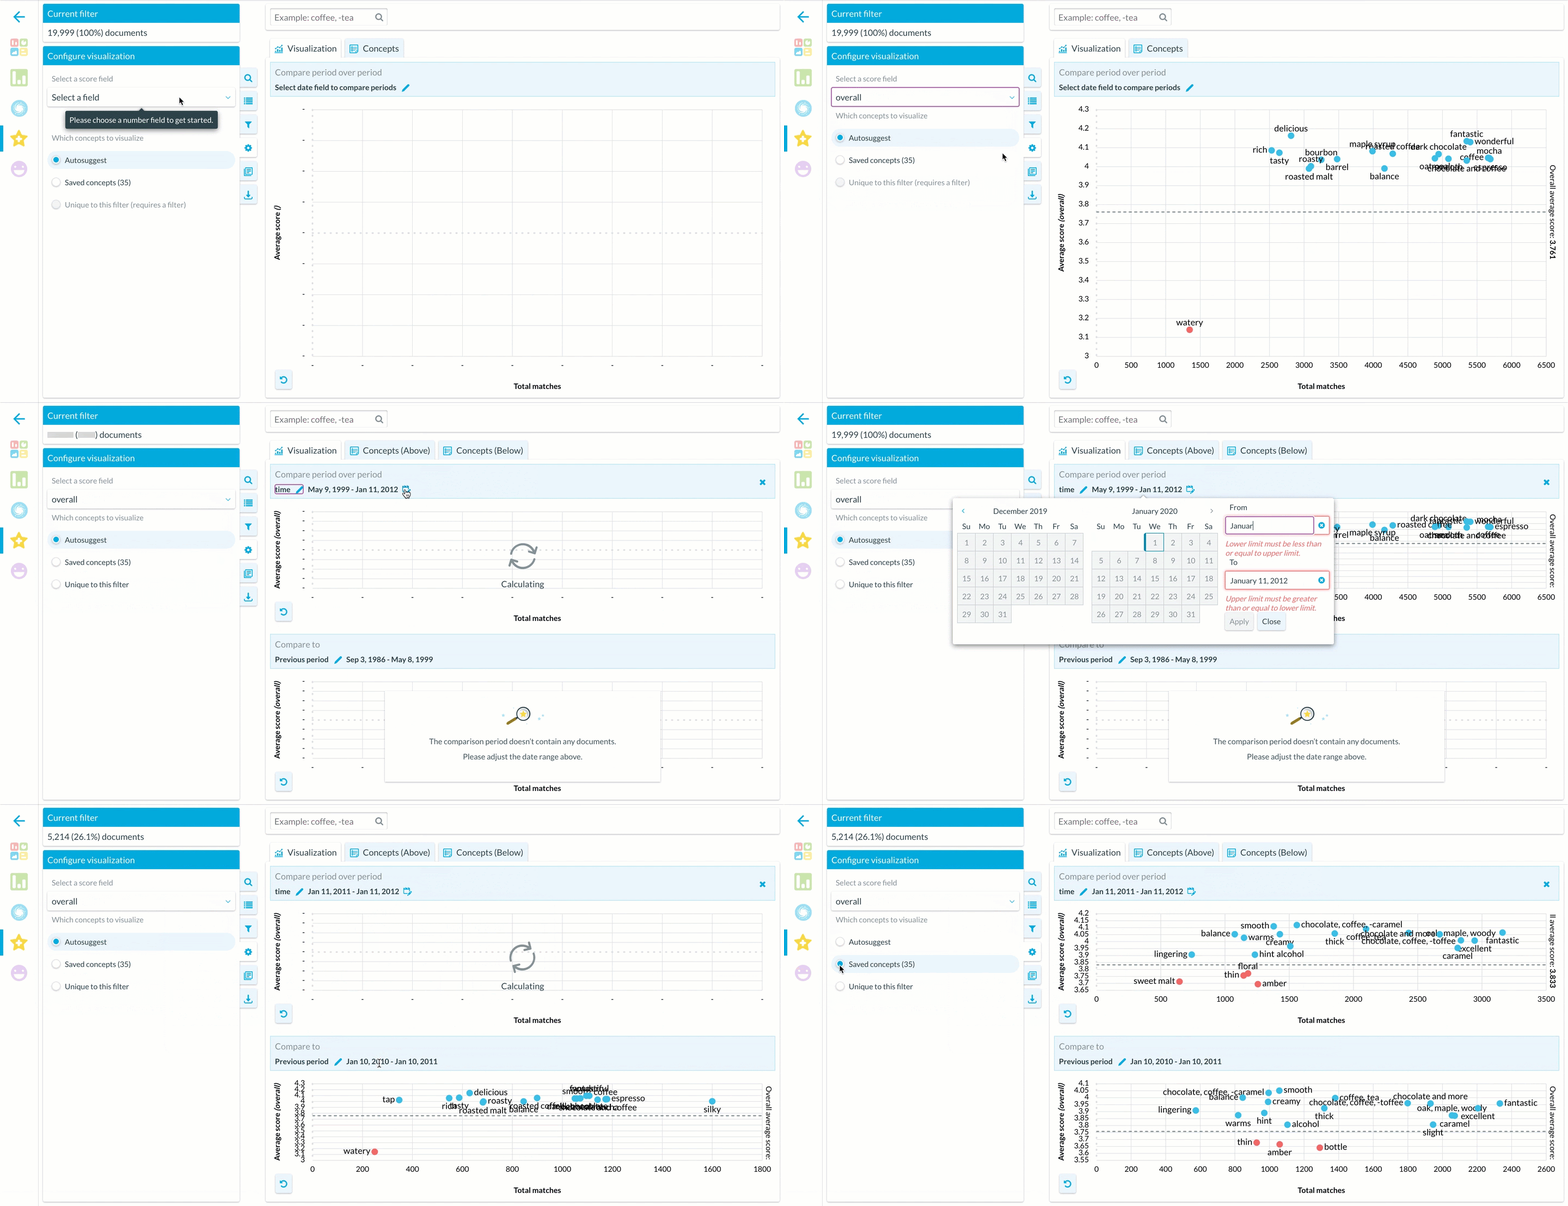
Open Daylight and select the Drivers feature.
In the Configure visualization tab, select a score field from the menu.
Choose Autosuggest, Saved concepts, or Unique to this filter from the Which concepts to visualize section. Concepts that Daylight identified as strongly influencing your score are auto suggested. Alternately, save concepts that are relevant to your business to view them in Drivers. Finally, use the Unique to this filter option to identify auto suggested concepts that are uniquely relevant to any filters you’ve applied, as compared to the rest of your dataset.
Click the pencil icon next to Select date field to compare periods and select your desired date field from the menu. The visualization splits into two scatterplots. The top scatterplot automatically displays the full date range for the filter you applied.
Refine the date range in the top scatterplot to an interval you’re interested in. The bottom scatterplot automatically identifies and displays the same size time interval ending a day before the interval you selected for the top pane. For instance, if you selected a 10-day interval of time, the bottom scatterplot would display the previous 10-day interval.
Change the date interval in the lower scatterplot, if desired. Each scatterplot displays the most relevant auto suggested or saved concepts for that period of time.
To configure Drivers concepts using the concept tab
As part of this change, we also introduce a Concepts tab at the top of the Drivers visualization. Use this tab to select the concepts you view in the single drivers visualization, or independently for the top and bottom comparative visualizations.
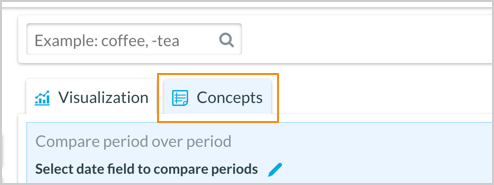
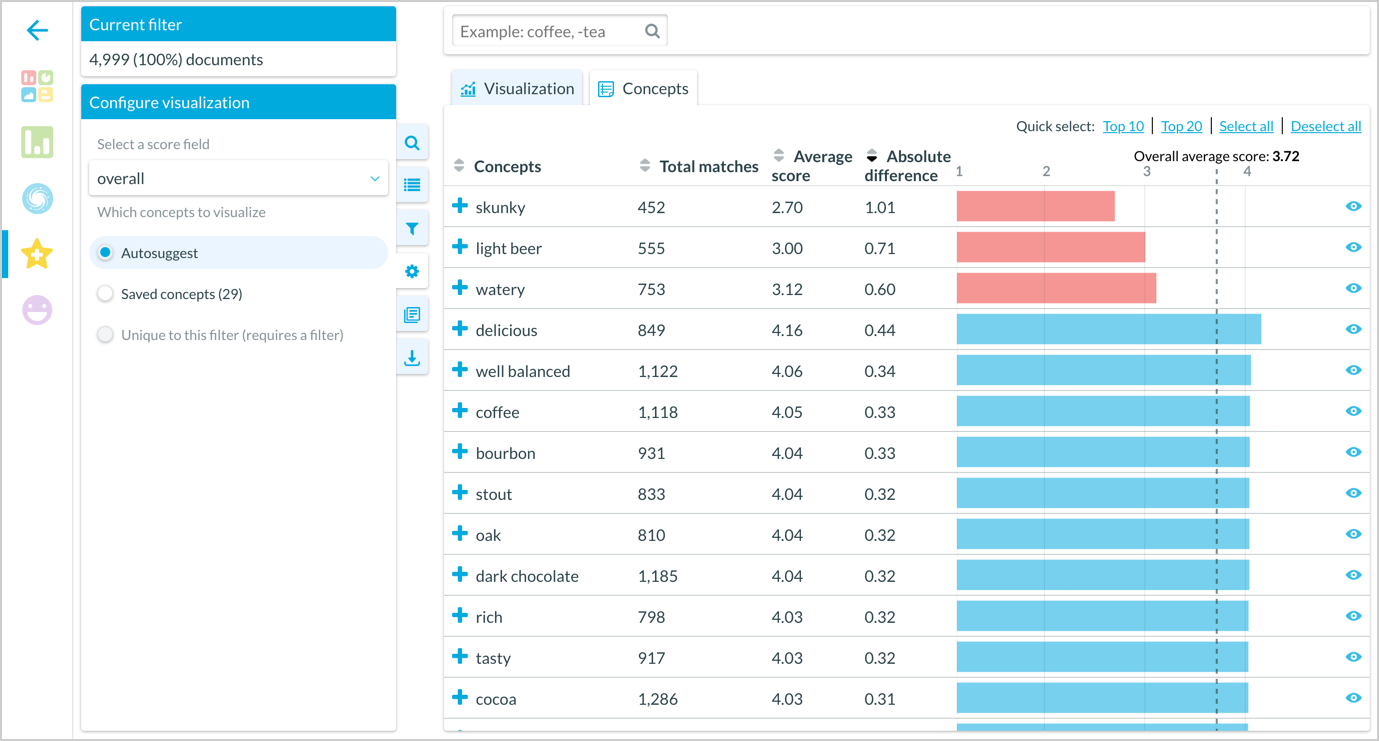
Click the Concepts tab. It opens to a list of concepts that match whatever score field and type of concepts to visualize you selected, sorted by absolute difference.
Configure the concepts to match what you want to see in the scatter plot visualization:
Quick select the top 10 or 20 concepts. Top concepts vary by the type of sorting you apply, but default to concepts with the greatest absolute difference.
Order concepts by Concepts, Total Matches, Average score, or Absolute difference. This order affects which concepts appear in your top 5, 10, or 15 concepts.
Click Deselect all to deselect all concepts.
Click the view icon in a concept row to select or deselect a specific concept.

If you want to remove a concept from the visualization, deselect it. Only selected concepts appear in the scatter plot.
In Concepts (Below), toggle on Same concepts as top scatterplot to match the concepts that appear in the bottom scatterplot to the concepts that appear in the top scatterplot. If a concept was not discussed during the previous period or year over year period, it does not appear in the bottom scatterplot.
Hover or click on a concept to see a tip appear in one or both scatterplots.
Click Visualization to reopen the Drivers scatterplot and view your selected concepts.
To organize concepts in separate Drivers trend analysis panes
Make sure the Drivers visualization is showing the dates you want to use, and that you’ve selected either Autosuggest or Saved Concepts in the Configure visualization tab.
Click Concepts (Above) or Concepts (Below) to edit the concepts you view in each scatterplot. Depending on your needs, you may wish to view the same or different concepts in the top and bottom panes.
Single sidebar project completed
With this release, all changes that are part of our ongoing single sidebar project are complete. Now Daylight only has a left-hand sidebar with tabs where you can:
View all information for concepts
Manage saved and suggested concepts
Apply filters
Configure feature visualizations
View documents
Create exports
Updated order to sidebar tabs
Now, tabs in the sidebar are reordered to better reflect how users move through Daylight. The new order is:
Search details
Select concepts
Filter documents
Configure visualization
Documents
Export & share
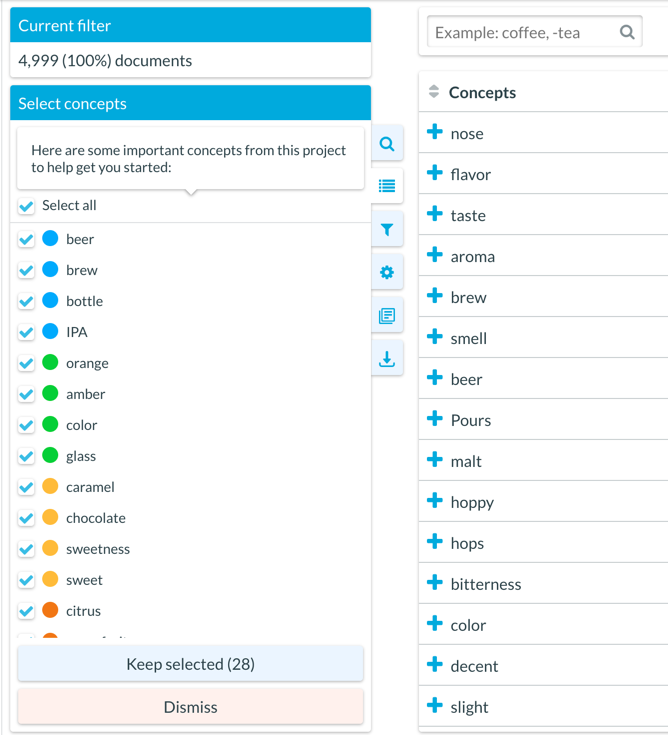
Tooltips added to sidebar tabs
With this release, we also add tooltips to each sidebar tab. Hover over each tab to see its name appear in a tooltip.
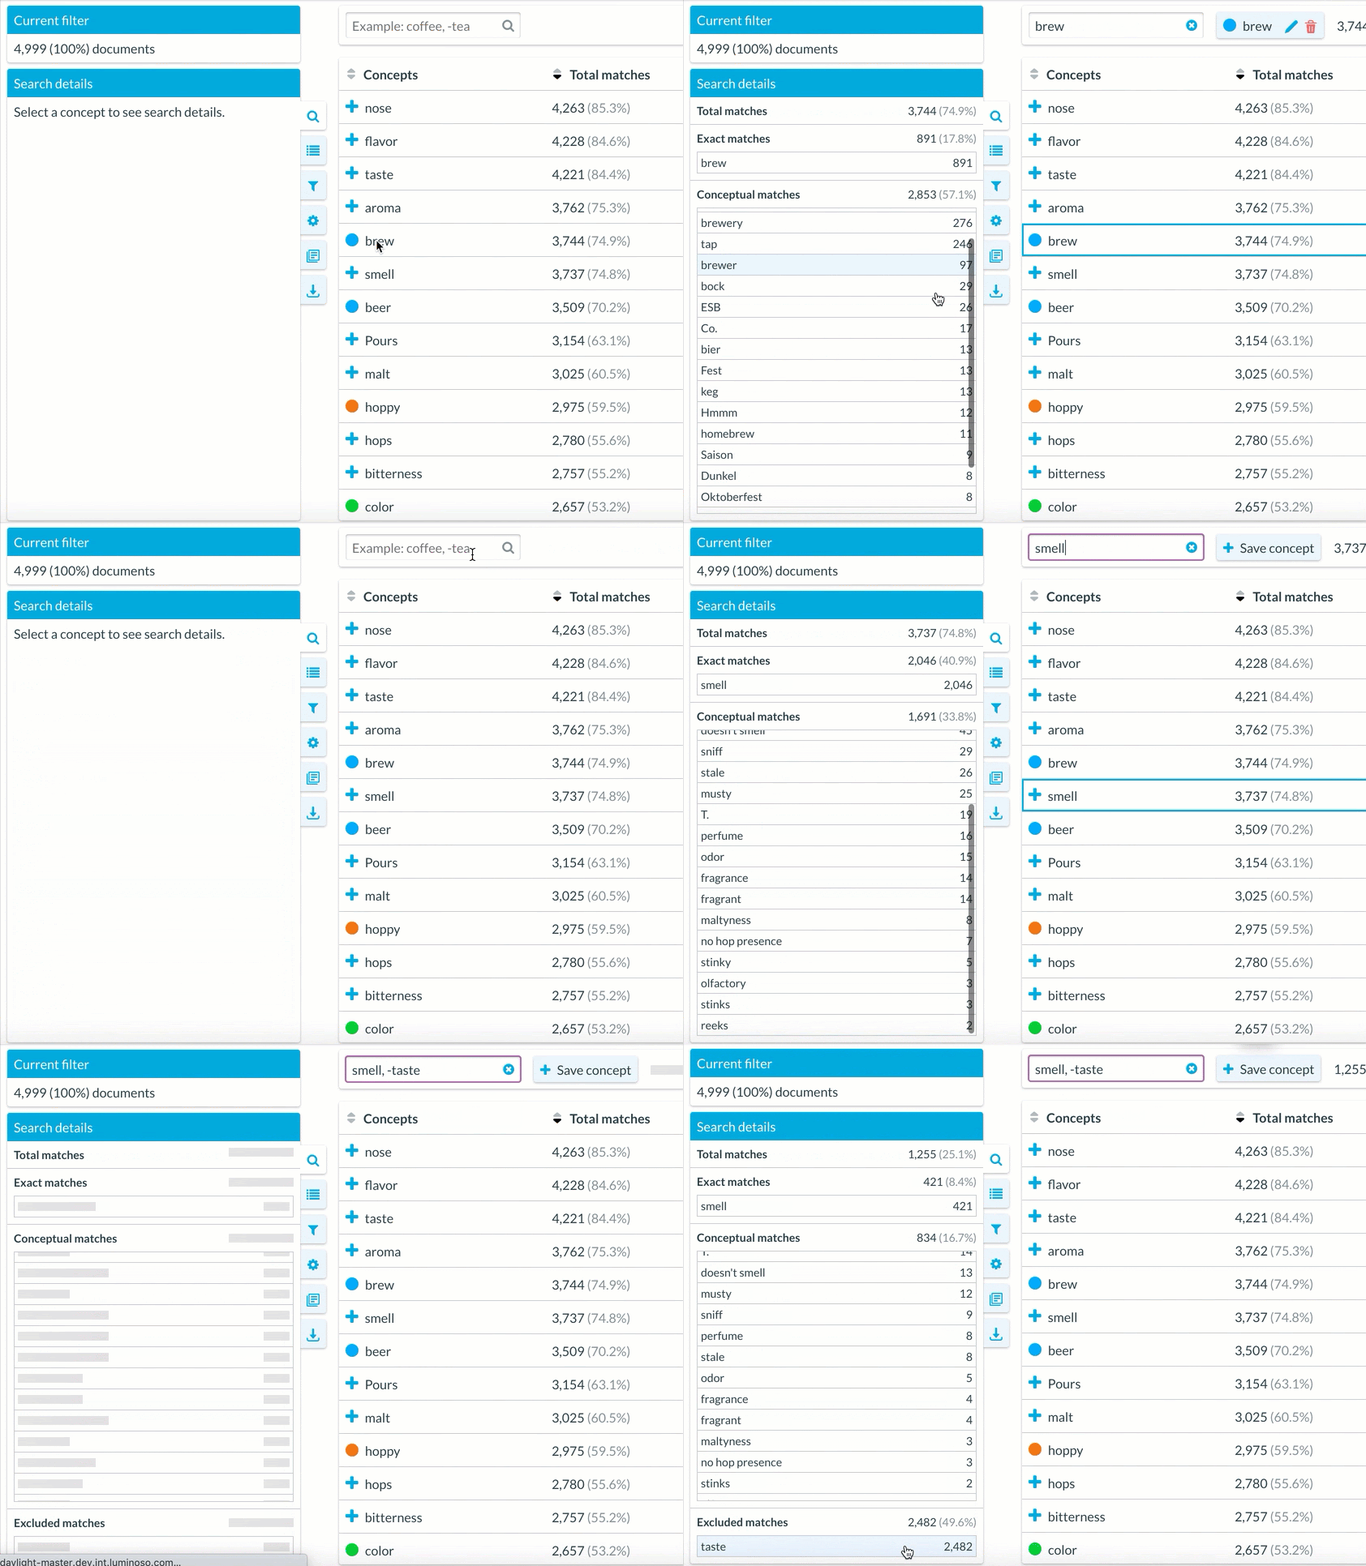
New Search details tab
With this release, we move all previous Concept details information into a new Search details tab. View exact, conceptual, and excluded match information for concepts. You can select concepts by:
Clicking a concept name in the feature.
Entering concept(s) in the search bar.
Note: You must use the search bar to view details for multiple concepts at the same time, unless you have saved a previous advanced concept search.
New Documents tab
With this release, we move all document information that matches your filter and search selections from the right-hand Documents section into a new Documents tab in the left sidebar.
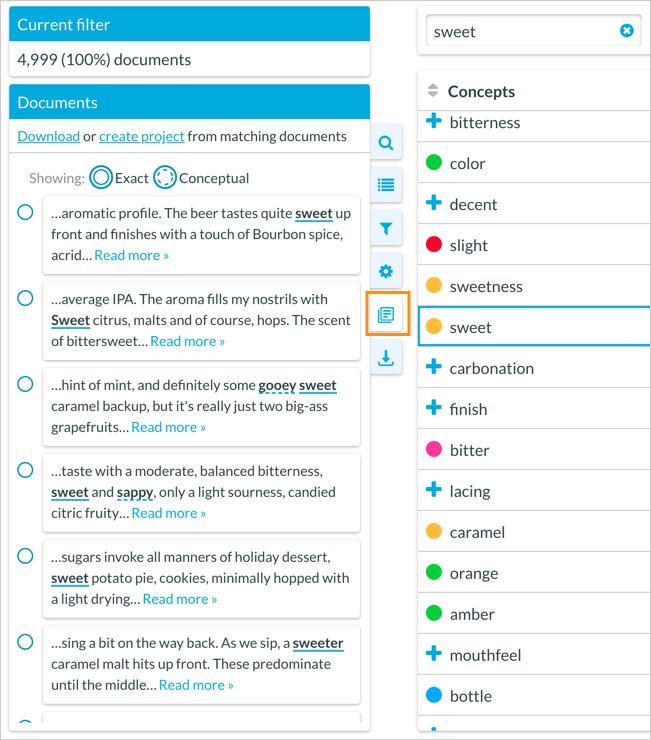
Use this tab to explore relevant documents in depth. If you’re viewing documents related to a specific concept, you can use the Exact and Conceptual icons to view only documents that contain exact or conceptual matches.
Click Download to view all matching documents in a spreadsheet. Click create project to create a project that includes only documents that match your concept and filter configurations.
New Exports tab
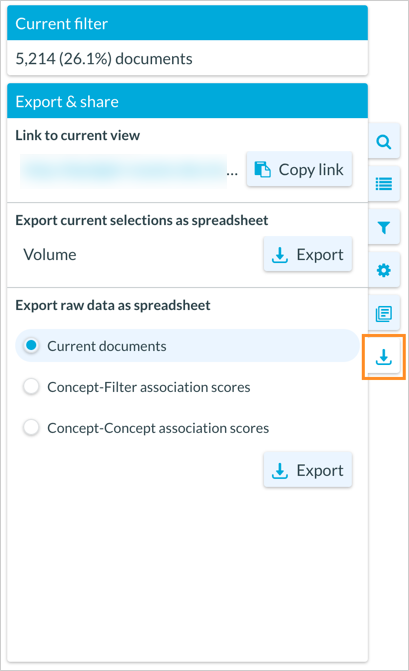
With this release, we move all Daylight exports into a new Export & share tab. This tab combines several ways to export information from Daylight:
Link to current view – Click Copy link to copy a link to your current view in Daylight. The link will bring you or anyone you share it with directly to all concepts, feature and filter configuration information you’re viewing.
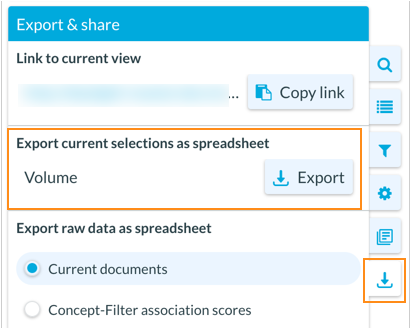
Export current selections as spreadsheet – Click Export to download a spreadsheet based on the feature information you’re currently viewing. Selections reflected in this spreadsheet include filters, the type and number of concepts you’ve chosen to visualize, and Unique to this filter.
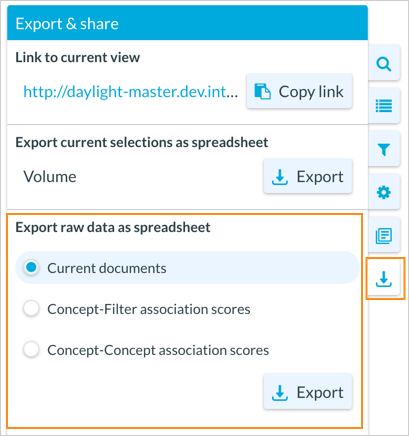
Export raw data as spreadsheet – Click Export to download a spreadsheet, after using a radio button to select one of the following options:
Current documents – Download all documents in your project that match your filter and concept selections. This download also includes all metadata for your project.
Concept-Filter association scores – Download a spreadsheet that contains the level of association between the metadata filters in your project and any concepts you selected. Daylight identifies these associations as part of the upload process, and associations may change depending on project size.
Concept-Concept association scores – Download a spreadsheet that contains the level of association between concepts you selected. Daylight identifies these associations as part of the upload process, and associations may change depending on project size.
Removed bottom left downloads icon
With this release, we remove the downloads icon from the bottom left corner of the app.
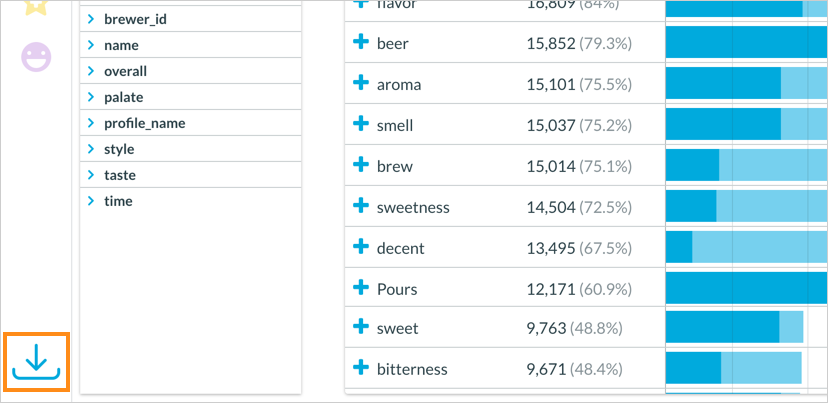
We also remove the Match counts download entirely, since the same information is available through opening Volume and clicking Export in the Export current selections as spreadsheet section.
Now, the Concept-Filter and Concept-Concept association scores downloads that you previously accessed through the bottom left download icon are available in the Export & share tab of the sidebar left sidebar.
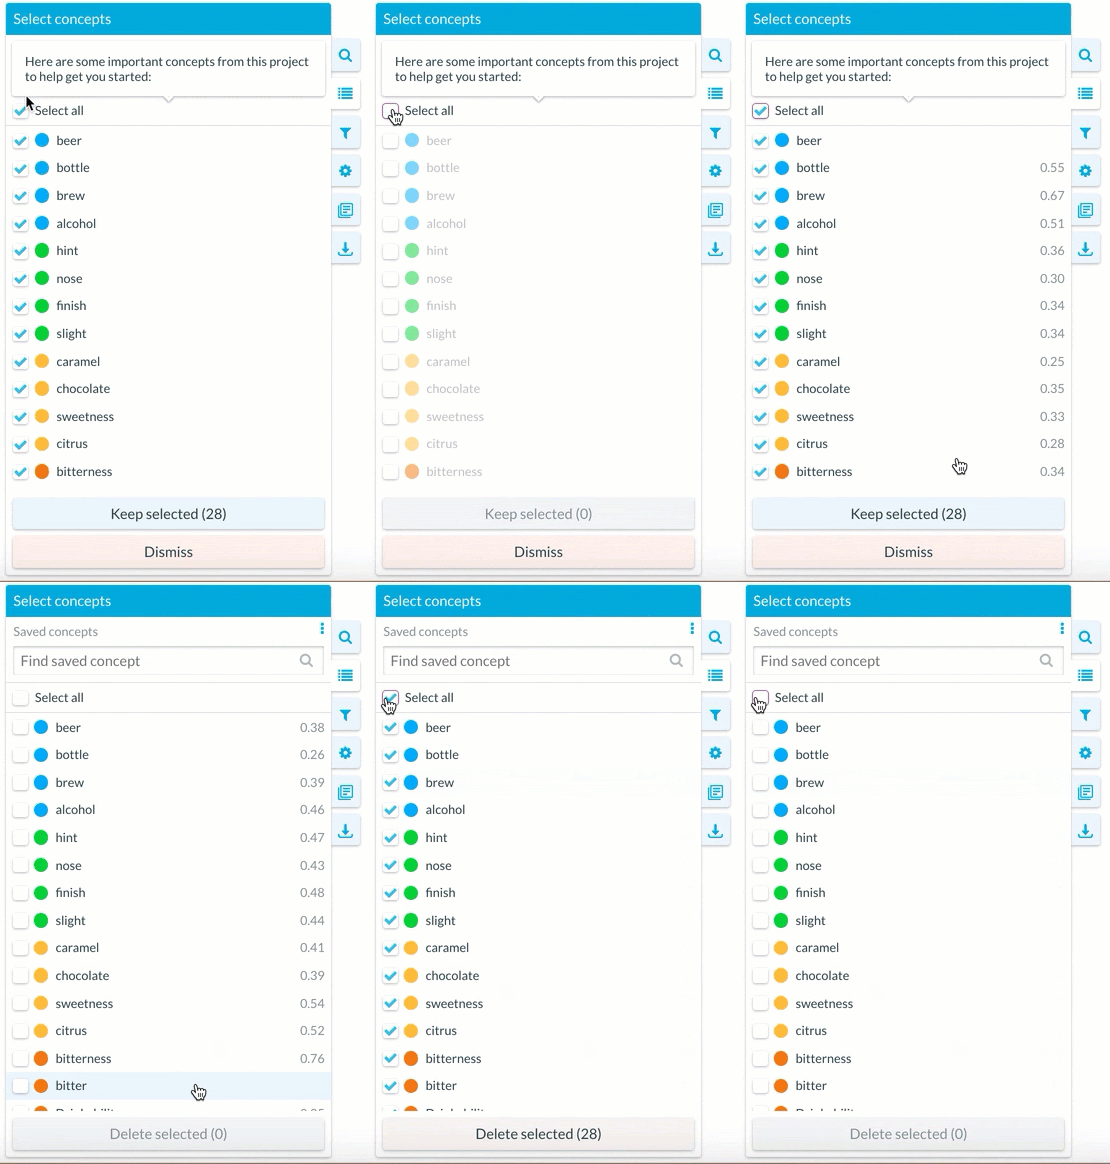
Select or deselect all suggested concepts
With this release, we make it possible to select, or deselect, the entire contents of the Select concepts list by checking or unchecking the Select all box.
Concepts with positive and negative sentiment no longer appear twice in concept list
Previously, if Luminoso determined with high confidence that a concept had both strong positive sentiment and strong negative sentiment, it would appear twice in the list of sentiment suggestions in both the API and UI.
Now, concepts that fit this description are only included once, which is more intuitive for users.
